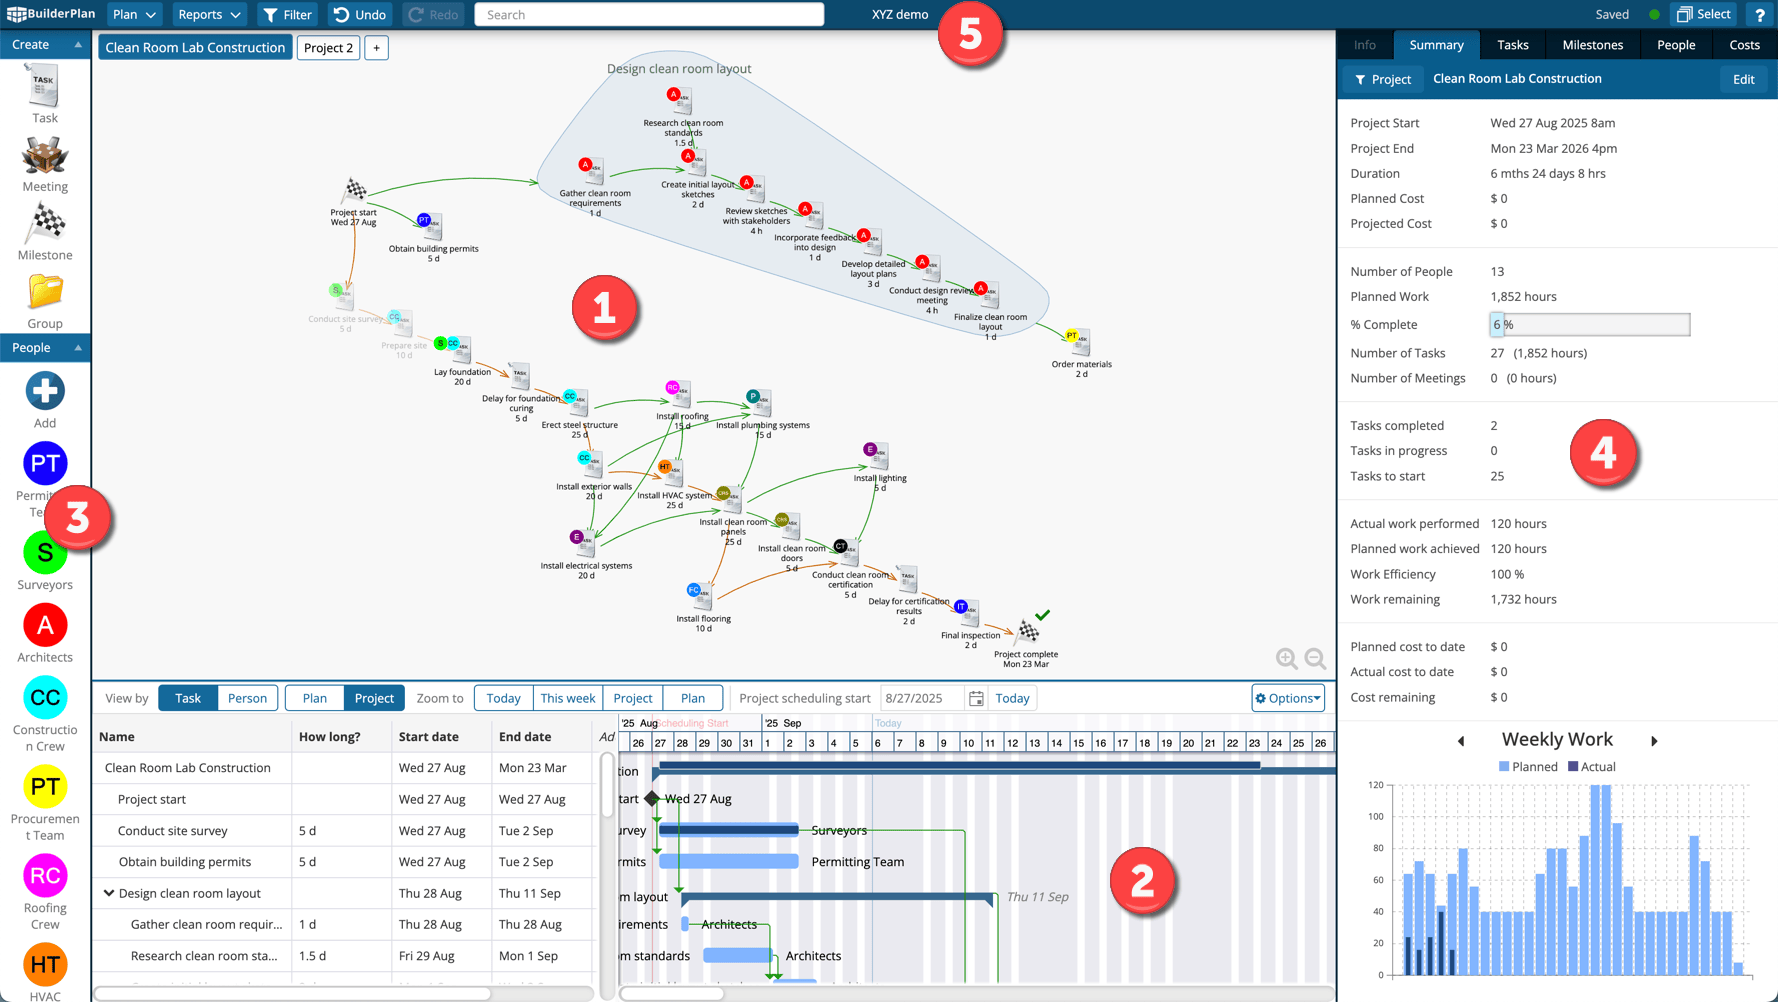
When you first open the application, the screen is divided into five main areas. Each area has a specific role in helping you plan, schedule, and communicate your projects. The numbered circles in the screenshot match the descriptions below.
1. Whiteboard
The Whiteboard is the central hub of the application.
Here you create your plan visually, just like using a real whiteboard in a boardroom session. By combining text, symbols, and arrows, you can quickly map out tasks, dependencies, and milestones in a way that is easy for your team to understand.
This is a key differentiator compared to other scheduling tools, where users typically enter tasks directly into a Gantt chart — a process that can be slow and error-prone. In this application, the Gantt chart is automatically created as you plan on the Whiteboard. The Whiteboard also serves as a powerful communication tool when presenting your plan.
2. Gantt Chart
The Gantt chart is displayed below the Whiteboard and shows the project schedule. The Whiteboard and Gantt chart are fully interactive:
-
Selecting an item on the Whiteboard highlights it in the Gantt chart, scrolling the Gantt chart if necessary to show the selected item.
-
Selecting an item in the Gantt chart highlights it on the Whiteboard.
The divider between them can be dragged to resize either view. Hovering over the divider displays a down arrow button, which collapses the Gantt chart to maximize the Whiteboard.
3. Icons Panel
The Icons Panel, located on the left side, contains the building blocks of your plan:
-
Tasks, Meetings, Milestones, and Groups
-
People and Equipment resources
You can drag and drop icons from this panel onto the Whiteboard to create tasks and assign resources.
4. Data Panel
On the right side, the Data Panel provides detailed information and insights. It can be collapsed when not needed and includes the following tabs:
-
Info – Properties of the selected item (tasks, meetings, groups, or resources).
-
Summary – High-level overview of the entire plan or active project.
-
Tasks – A list of tasks in progress or yet to be done.
-
Milestones – All milestones in one place, with clear status indicators if a due date has been entered:
-
✅ Green check mark – milestone achieved or on track.
-
⚠️ Warning sign – milestone at risk of missing due date.
-
❌ Red X – milestone missed.
-
-
People – Information on resources in the plan, both planned and actual.
-
Costs – Displays project cost data if entered.
5. Toolbar
The Toolbar runs along the top of the screen and gives access to key commands and menus.
From here, you can manage plans, generate reports, apply filters, undo/redo actions, and search.
On the far right, the ? icon opens the built-in Knowledge Base, where you can find help articles like this one.
✅ Together, these five areas create a user-friendly workspace. The Whiteboard serves as the central hub for planning, while the Gantt chart, panels, and toolbar provide supporting tools to keep your projects on track.